
Ny sortering i Tilbudsdata Analyse
Traditionelt har vi i Tilbudsdata kørt med 2 forskellige kampagneandelsvisninger, nemlig Antal Kampagner og Sum af Andel af Kampagner.
Antal Kampagner tæller antallet af produkter på samme prispunkt og vil f.eks. betyde at en Chokoladeplade og en Chokoladebar til samme pris vil tælle som 2 kampagner.
Sum af Andel af Kampagner vil tælle de 2 produkter som 2 gange 0,5 og dermed give 1, men vil give nogle andre udfordringer hvis der f.eks. optræder flere produkter fra forskellige mærkevareindehaver.
I Tilbudsdata bruger vi mange ressourcer på at udvikle, så vi ikke bliver fanget i den fælde der hedder ”One Size Fits All”, for vores måde at arbejde med data på er forskellige. Både fra firma til firma, men også i de forskellige afdelinger ude hos jer.
Derfor har vi nu udviklet en ny summering, der gør det nemmere at vælge sin helt egen løsning.
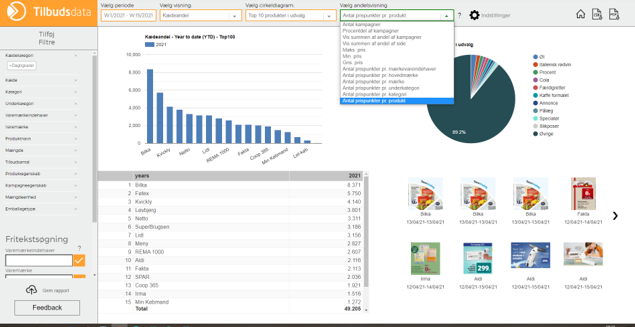
Summeringerne er tilføjet under Andelsvisning i Tilbudsdata Analyse og fokuserer på ”Antal prispunkter pr ...”.
Hvis du har spørgsmål vedrørende visninger eller i øvrigt, så skriv til Stina Hofmann på sh@tilbudsdata.dk.
Hvis du har brug for et Brush-up på Tilbudsdata eller du ikke rigtig er kommet i gang med at bruge Analyse-delen endnu, så deltag på en Online Workshop - læs mere og se datoer her.
New way to sort data in Tilbudsdata Analyse
Tilbudsdata primarily used to have two different share views, namely "Count of ads" ("Antal Kampagner") and "Sum of Share of Ads" ("Sum af Andel af Kampagner").
"Count of Ads" counts the number of products at the same price point, meaning that e.g. a plate of chocolate and a chocolate bar shown in the same ad with the same price counts as 2 campaigns.
"Sum of Share of Ads" counts the two products as 2 times 0.5, which is 1. However, this may cause other issues, e.g. if there are multiple products from different brand owners shown in the same ad.
At Tilbudsdata we spend a lot of resources on developing our product in order to avoid falling into the trap of "one size fits all", because each company, and often also each department within a company, has its own unique way to work with data.
Consequently, we have now developed several new share views that will make it easier for you to choose how you want to see the data.
These new share views can be found under "Share views" ("Andelsvisning") in the Online Analysis tool and each of them show a different variation of "Number of price points per …" ("Antal prispunkter pr. ...").
If you have any questions regarding share views or other features, please contact Stina Hofmann at sh@tilbudsdata.dk.
If you need a brush up on Tilbudsdata or if you have yet not started using the Online Analysis tool "Tilbudsdata Anlalyse" then feel free to sign up for an Online Workshop - check here for more info and dates.